Categories
Fansure Feed

The Fansure Index: Measuring the Superstar Effect

Superstardom and Dark Matter

How and when does an NBA player transcend from being simply an elite athlete to the near-mythical status of “superstardom”? With the obvious exception of LeBron James who was anointed a basketball King in his freshman year of high school, it is rarely obvious when this transition is happening. In retrospect, we can convince ourselves that the signs were there, but in truth there are many contributing factors that must come into alignment at just the right time for a player to emerge as a superstar. The multi-dimensional nature of superstardom makes it difficult to see as it is crystallizing. The elements that come together to form a superstar are a function of both on-court performance and off-court factors. When we have a superstar on our hands, these elements combine to form something that is greater than the sum of the individual parts.

Through the lens of a recovering rocket scientist, the alchemy of superstardom looks awfully like dark energy or dark matter – something that we do not have a descriptive framework for, but is pervasive and has very tangible effects that cannot be explained in its absence. Today, we at Fansure have made significant strides in peering behind the curtain of superstardom and quantified it with the Fansure Player Index. Solving the grand challenges of astrophysics will be left to our good friends over at NASA.


The Fansure Player Index

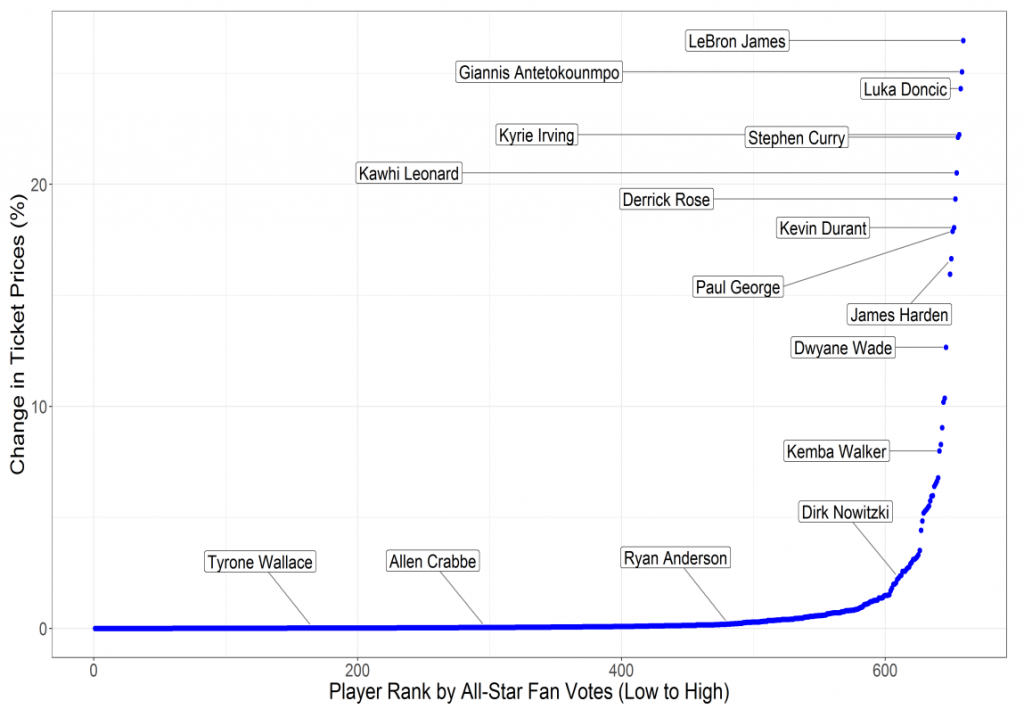
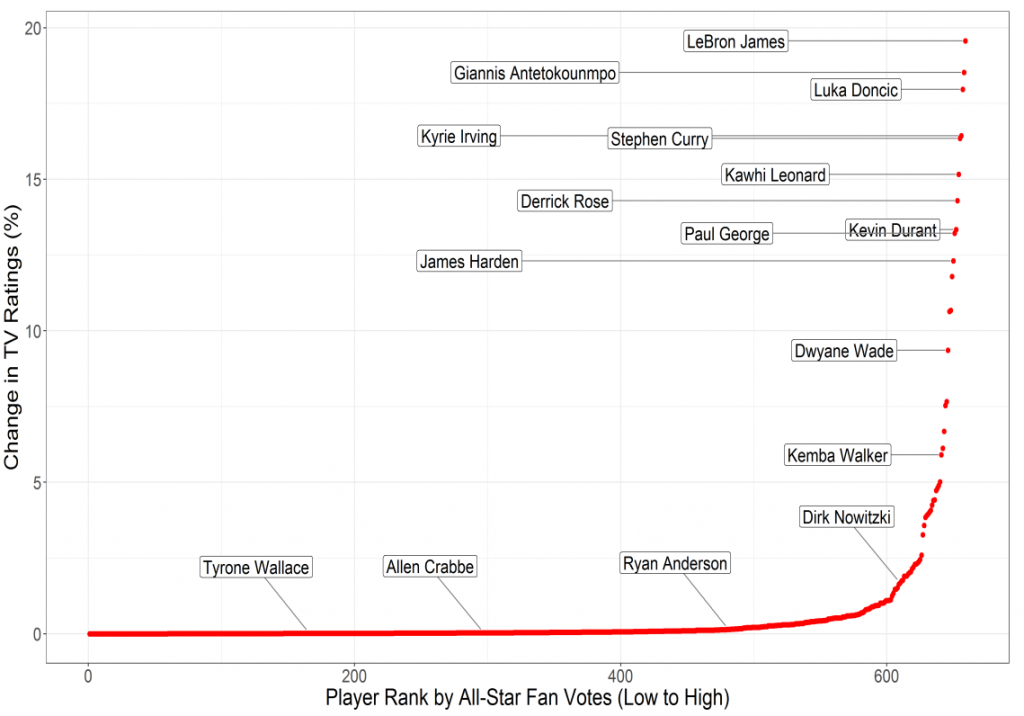
There is body of literature describing the observed economic effects of superstars [1-3]. Some of the most recent work in this area comes from our very own Scott Kaplan who has measured the impact of superstar popularity on secondary market ticket prices and Nielsen ratings (Figure 1). This research indicates that there are clearly a few tiers of players and only those in the upper echelon can individually move the needle for fans – as measured by ticket prices and viewership ratings.

Ticket Price (top) and TV Ratings (bottom) Impacts for All NBA Players (Ranked by # of Fan All-Star Votes)

What we are doing here is looking upstream of these end results to propose a metric that attempts to capture the contributing factors that generate a superstar and quantifies them through the Fansure Player Index. The direct on-court metrics which feed into the Fansure Player Index include a handful of well-known advanced metrics: John Hollinger’s Player Efficiency Rating (PER), ESPN’s Real Plus-Minus (RPM), Win Shares from Basketball Reference, and Game Score (also from John Hollinger). We synthesize all of these into one meta-advanced metric in an effort to balance out the imperfections of each statistic and get an average picture of the on-court contributions of each player.

In addition to the wonky advanced statistics, the Index also includes MVP odds and All-Star Votes. These factors are partially related to statistical performance, but also infuse some less tangible information into the Index regarding the perception of players. Finally, the Index includes fan-engagement related factors including the social media footprint. All of these metrics are rolled up into one number: The Fansure Player Index, where a “perfect” superstar is rated 100.

Future versions of the Index will include jersey sales to further inform the fan-engagement facet of superstardom and the number of “exciting” plays that a player creates (dunks, blocks, long-distance 3-pointers, for example) to add another dimension to the on-court performance of players.


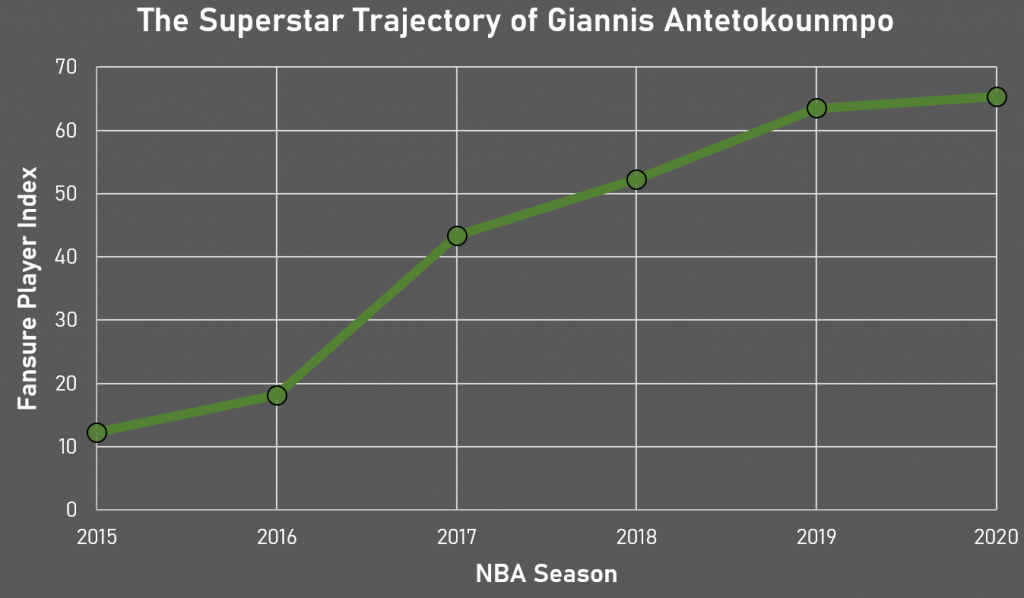
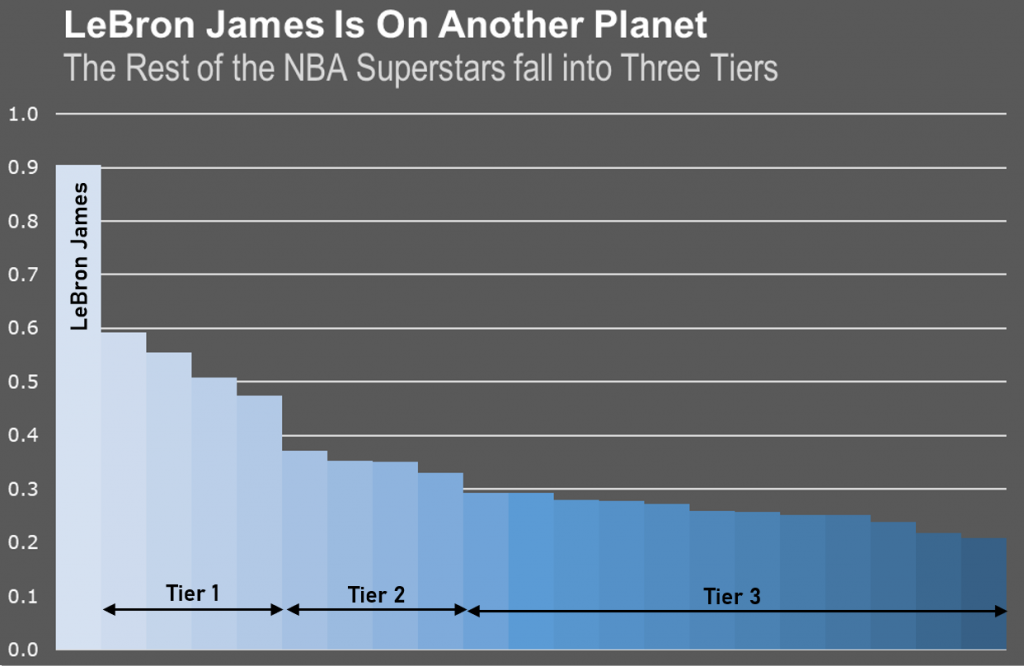
To nobody’s surprise, LeBron James is an absolute outlier. What is insightful here is to see the moat between him and the rest of the back quantified. When healthy, the second highest player on the Fansure Player Index is Stephen Curry (rated at 60.6 before the start of the season). With Curry injured this season, Giannis is holding down the second spot en-route to his second straight MVP caliber season. The steady climb of Giannis’ Index rating over the last five seasons is shown in Figure 2.  Still, Giannis and Curry are closer to the 10th or 11th player on the list than they are to King James.

Giannis Antetokounmpo’s Fansure Index has risen meteorically since the 2014-15 NBA season

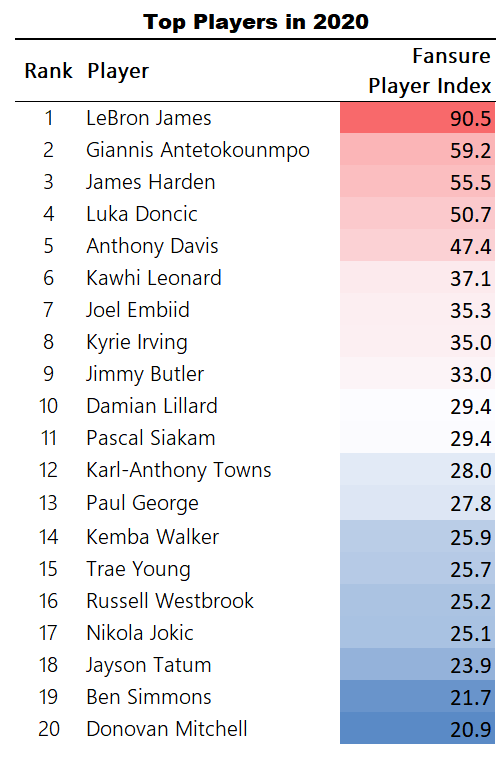
Beyond LeBron, there are clearly a few tiers of players as measured by the Index. The Tier 1 players appear to end with Anthony Davis at #5 and include those you would expect (Curry and Durant are in this tier when healthy), but also indicate just how quickly Luka Doncic has exploded onto the scene. In all likelihood Zion Williamson will find himself in this category in the very near future. A perhaps surprising omission from this top tier is Finals MVP Kawhi Leonard, who pays a pretty substantial superstardom price for not being on social media.

The second tier of superstars includes Kawhi, Joel Embiid, Kyrie Irving, and Jimmy Butler. Beyond that, there is a relatively slowly decreasing cascade of players which, rounding out the top 20 players, we will call Tier 3.

Fansure Player Index Distribution of the Top 20 Players

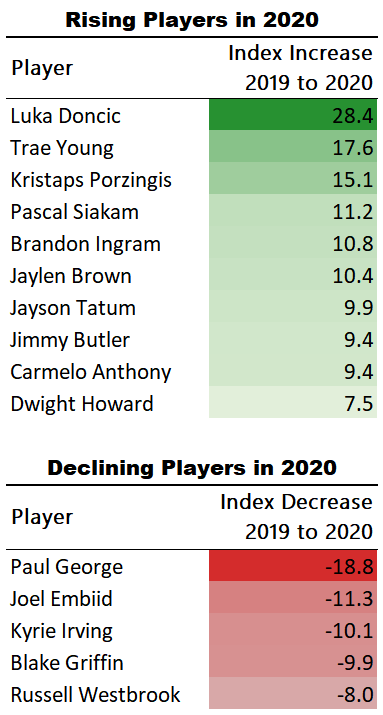
Comparing the Index of players from last season to this season, we see that some of the biggest increases belong to the younger generation of players who are starting to shine and those who are experiencing resurgence years (Porzingis, Carmelo Anthony, and Dwight Howard). Despite having an impressive first season with the Clippers, Paul George has regressed from his near-MVP season last year, due in part to the injury he dealt with at the beginning of the season. As such, his All-Star vote totals and advanced statistics have taken a pretty appreciable step backward this season and, after being ranked as high as #6 last year, he has fallen to #13.

Rising and Falling Players in the Fansure Player Index

Summing It All Up

Fansure is a sports analytics company focused on predicting player availability that provides a variety of insights and services related to this core competency. In an effort to better understand the star players that dominate the NBA market we have developed a metric quantifying superstardom called the Fansure Player Index. This tool is being used to provide insights to everyone that is affected when superstar athletes are unavailable: fans, ticket retailers, teams, TV networks, fantasy sports participants, and the sports betting sector. We also use the Fansure Index to define the “top” players in our portfolio for our ticket protection product which provides fans a way to protect their in-game experience when their favorite player is absent and is live today at fansure.com.

Be sure to check back in after the final All-Star vote tallies have been announced when we will provide another update and also tell you about how we can measure franchise value using the cumulative contributions of the players on the court in addition to a similar index metric for team-related factors.

References

[1] Hausman and Leonard 1997, [2] Humphreys and Johnson 2017 [3] Kaplan 2020

Categories
Fansure Feed

Understanding the Economics of the NBA Regular Season

Why the NBA Regular Season does matter  

NBA media and other folks have been touting the regular season as much too long and relatively dull. They say the stakes for an individual game are simply too low.  

There are several factors that play a part in this viewpoint. First, there are 82 games spanning the course of 7 months, the longest of all major U.S. professional sports. Because of its length, the NBA competes with College Football bowl games, the NFL regular season, the NFL playoffs, and even NCAA March Madness.  

“Load Management” has also taken hold, suggesting that the value of winning an individual game can sometimes be so low that players are better off “preserving themselves” for a potential playoff run, and thus sit out of some of these games (often times during back-to-back scenarios).  

When turning to the quantitative metrics, the case that the regular season is too long only becomes stronger. FiveThirtyEight uses a metric to understand how much information each game in the regular season carries, determining the point in the regular season where a team’s record represents 50% luck and 50% skill. There are some striking discrepancies across major U.S. professional sports – in the NFL it takes 11 games, the MLB 67 games, and the NBA a strikingly low 12 games. 

Taking this argument a step further, you would only need a 17.5 game regular season in the NBA to provide as much information about each team as the 16 game NFL regular season. Nobody is advocating for that short an NBA regular season, but the point rings true – it’s clear that from a competitiveness standpoint, the NBA regular season appears to be way too long. So what justifies its length?

The primary allure and unique feature of sports is the competitiveness aspect, namely uncertainty in the outcome of a matchup and designed parity across a league. For instance, a study analyzing Monday Night Football games found that TV ratings are primarily determined by a quality match-up between winning teams, a high level of uncertainty of outcome, and high-scoring (Paul and Weinbach 2007). The same finding is true in College Football BCS games, where ratings increase systematically throughout a contest when the outcome of that contest becomes more uncertain (Salaga and Tainsky 2013).

Yet, one of the important distinctions between the NBA and most other professional leagues (potentially excluding European soccer) is the starpower of the players, and how their popularity drives viewership independent of the competitiveness or of the quality of the two teams in a game. In fact, my independent research finds that the competitiveness of a single matchup (as measured by the point spread) isn’t a significant predictor of ticket prices or TV ratings in regular season NBA games.

While this isn’t a one-to-one comparison with the broader metric of how good each team is (as measured by their W-L record or playoff probability), which our research shows to be a strong influencer in ticket prices (and less so in ratings), it is an indicator that there are other important factors driving demand for the NBA regular season product.

On the other hand, popularity of players in a matchup is a huge driver of ticket prices and ratings. In fact, it can be even more important than the combined quality of the two teams playing! Have you ever gone to a game and seen Michael Jordan or Kobe Bryant in person? How about LeBron James or Steph Curry? These are the most talented, most skilled, most explosive athletes this planet has ever seen, and their presence alone is worth the price of admission. There is a “superstar” effect that transcends the competitiveness of a game, how good the two teams playing are, and the market size of each team, among other factors, which makes the NBA a uniquely different product than hockey, baseball, and even football. 

The set of “hockey stick” graphs below reinforce this point. In economics, the nature of a superstar is represented by huge increases in value as you move towards the most talented individuals in an industry (shown in seminal research by one of the most well-known economists in history, Sherwin Rosen).  

HockeyStickGraphs

Figure 1. Ticket Price and TV Ratings Impacts for All NBA Players (Ranked by # of Fan All-Star Votes) 

As you can see here, once you start to move into the top 10-15 players from a popularity standpoint (as measured by their All-Star fan votes over the 2017-18 and 2018-19 NBA seasons), the increases in ticket prices and TV ratings become sizable and significant. For instance, in games LeBron James plays in, the average ticket price increase compared to a typical game is on the order of 20-25%. We see similar effects with some of the other most popular players, including Luka Doncic and Stephen Curry.  

The fact that there are 82 chances in a regular season (and 41 at home) to see these athletes perform, regardless of the other conditions surrounding the game, should be accounted for when we make arguments about the regular season. It’s also evident that the “number of chances” to see the most popular players matters – while the average impact on ticket prices when LeBron or Steph don’t play is between $30-42 per ticket, when they miss away games the price impact ranges from $55-75 per ticket (Kaplan et al. 2019).

Now, the new age of load management has thrown a sizable wrench into this construct. There is a case to be made that the regular season is indeed too long if the top stars are going to take nights off (or choose not to play with minor injuries that players used to play through), which is a shared sentiment among some writers. Under these conditions, the product no longer has the appeal it’s designed to produce, and fans paying hard-earned money or advertisers expecting a certain number of viewing households are now experiencing reduced value.

These factors may suggest benefits of a slightly shorter regular season (which the NBA has already suggested) to avoid back-to-backs and space out games a bit. This way, expectations about the quality of the product can be better met for the several important stakeholders involved.

The most important takeaway is this: fans pay for the game-day experience. Who could possibly get tired of watching LeBron James or Stephen Curry play, no matter how good the other team, no matter how competitive the game, and no matter how the game may or may not impact playoff probability? More than any other professional sport, this is what makes the NBA different. The players are on center-stage, their athleticism on full display. More specifically, there are only 5 players on the court at a time, and each is perfectly visible (unlike football or hockey).

The narrative needs to be changed, and all of the factors considered. The regular season does matter to a whole lot of people that can’t afford to go to playoff games, or only get a chance to go to one or two games a year (and even that comes with a very high cost). The more chances we have to do that, the more reasonable are ticket prices and the more accessible the stars.

A longer regular season also makes sense for the stars themselves! Player salaries hinge on these revenues, and a much shorter schedule is going to have significant financial impacts. Relatedly, a significantly shorter schedule would reduce the window in which players receive national attention. With the current setup, players get to brand themselves for 9-10 months out of the year, something that doesn’t happen in other professional sports.

If you’re feeling interested in a deeper dive into the economics of superstar players in the NBA, check out our independent academic working paper that was featured at the 2019 MIT Sloan Sports Analytics Conference. Steph and LeBron fans will understand.